Learning area
Glossary
- Algebraic expression
An algebraic expression is formed by combining numbers and algebraic symbols using arithmetic operations. The expression must be constructed unambiguously according to the rules of algebra.
For example,
, and
are algebraic expressions, but
is not because it is incomplete.
- Algebraic fraction
An algebraic fraction is a fraction in which both the numerator and denominator are algebraic expressions.
- Algebraic term
An algebraic term is an algebraic expression that forms a ‘separable’ part of some other algebraic expression. For example,
and
are terms in the inequality
and
are terms of the polynomial
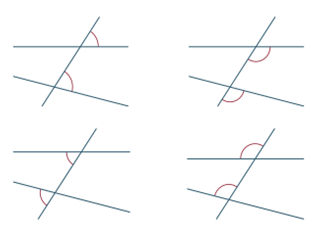
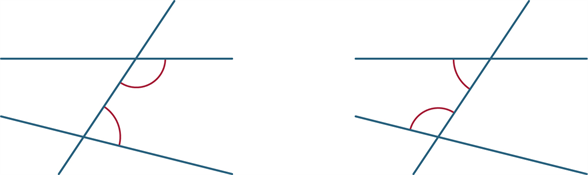
- Alternate
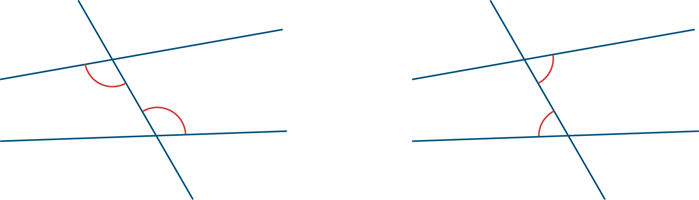
In each diagram below, the two marked angles are called alternate angles (since they are on alternate sides of the transversal).
If the lines AB and CD are parallel, then each pair of alternate angles are equal.
- Angle
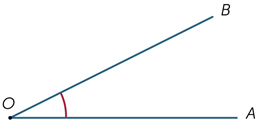
An angle is the figure formed by two rays sharing a common endpoint, called the vertex of the angle.
The size of an angle
Imagine that the ray OB is rotated about the point O until it lies along OA. The amount of turning is called the size of the angle AOB.
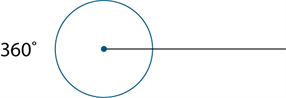
A revolution is the amount of turning required to rotate a ray about its endpoint until it falls back onto itself. The size of 1 revolution is 360o.
A straight angle is the angle formed by taking a ray and its opposite ray. A straight angle is half of a revolution, and so has size equal to
180o.Right angle
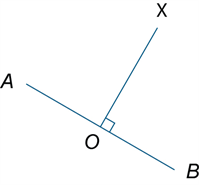
Let AOB be a line, and let OX be a ray making equal angles with the ray OA and the ray OB. Then the equal angles ∠AOX and ∠BOX are called right angles.
A right angle is half of a straight angle, and so is equal to 90o.
Classification of angles
Angles are classified according to their size.
We say that
- An angle with size α is acute if 0o < α < 90o,
- An angle with size α is obtuse if 900 < α < 180o,
- An angle with size α is reflex if 1800 < α < 360o
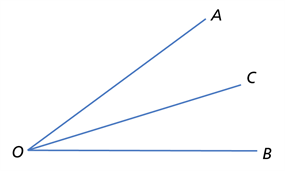
Adjacent angles
Two angles at a point are called adjacent if they share a common ray and a common vertex and lie on opposite sides of the common ray.
Hence, in the diagram,
- ∠AOC and ∠BOC are adjacent
Two angles that add to 90o are called complementary. For example, 23o and 67o are complementary angles.
In each diagram the two marked angles are called corresponding angles.
If the lines are parallel, then each pair of corresponding angles are equal.
Conversely, if a pair of corresponding angles are equal, then the lines are parallel.
Two angles that add to 180o are called supplementary angles. For example, 45o and 135o are supplementary angles.
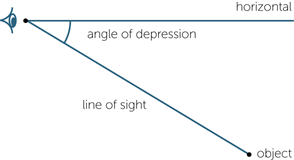
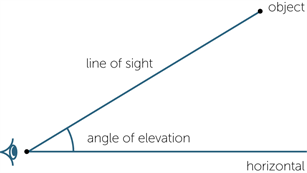
- Angles of elevation and depression
When an observer looks at an object that is lower than ‘the eye of’ the observer’, the angle between the line of sight and the horizontal is called the angle of depression.
When an observer looks at an object that is higher than ‘the eye of’ the observer’, the angle between the line of sight and the horizontal is called the angle of elevation.
- Array
An array is an ordered collection of objects or numbers. Rectangular arrays are commonly used in primary mathematics.
- Associative
A method of combining two numbers or algebraic expressions is associative if the result of the combination of three objects does not depend on the way in which the objects are grouped.
For example, addition of numbers is associative and the corresponding associative law is:
for all numbers
Multiplication is also associative:
for all numbers
but subtraction and division are not, because, for example,
and
- Back-to-back stem-and-leaf plot
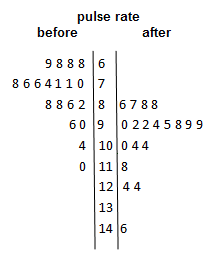
A back-to-back stem-and-leaf plot is a method for comparing two data distributions by attaching two sets of ‘leaves’ to the same ‘stem’ in a stem-and-leaf plot.
For example, the stem-and-leaf plot below displays the distribution of pulse rates of 19 students before and after gentle exercise.
- Bi modal
Bi modal data is data whose distribution has two modes.
- Bivariate data
Bivariate data is data relating to two variables, for example, the arm spans and heights of 16 year olds, the sex of primary school students and their attitude to playing sport.
- Bivariate numerical data
Bivariate numerical data is data relating to two numerical variables, for example height and weight.
- Box plot
The term box plot is a synonym for a box-and-whisker plot
A box-and-whisker plot is a graphical display of a five-number summary.
In a box-and-whisker plot, the ‘box’ covers the interquartile range (IQR), with ‘whiskers’ reaching out from each end of the box to indicate maximum and minimum values in the data set. A vertical line in the box is used to indicate the location of the median.
The box-and-whisker plot below has been constructed from the five -number summary of the resting pulse rates of 17 students.
The term ‘box-and-whisker plot’ is commonly abbreviated to ‘box plot’.
A five-number-summary is a method for summarising a data set using five statistics, the minimum value, the lower quartile, the median, the upper quartile and the maximum value.
- Capacity
Capacity is a term used to describe how much a container will hold. It is often used in relation to the volume of fluids. Units of capacity (volume of fluids or gases) include litres and millilitres.
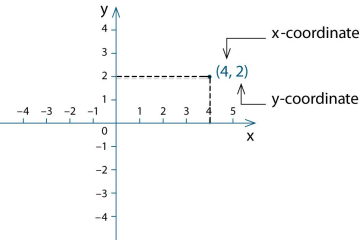
- Cartesian coordinate system
Two intersecting number lines are taken intersecting at right angles at their origins to form the axes of the coordinate system.
The plane is divided into four quadrants by these perpendicular axes called the x-axis (horizontal line) and the y-axis (vertical line).
The position of any point in the plane can be represented by an ordered pair of numbers (x, y). These ordered are called the coordinates of the point. This is called the Cartesian coordinate system. The plane is called the Cartesian plane.
The point with coordinates (4, 2) has been plotted on the Cartesian plane shown. The coordinates of the origin are (0, 0).
- Categorical variable
A categorical variable is a variable whose values are categories.
Examples: blood group is a categorical variable; its values are: A, B, AB or O. So too is construction type of a house; its values might be brick, concrete, timber, or steel.
Categories may have numerical labels, for example, for the variable postcode the category labels would be numbers like 3787, 5623, 2016, etc, but these labels have no numerical significance. For example, it makes no sense to use these numerical labels to calculate the average postcode in Australia.
- Census
A census is an attempt to collect information about the whole population.
A population is the complete set of individuals, objects, places, etc, that we want information about.
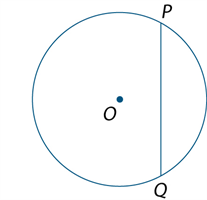
- Chord
A chord is a line segment (interval) joining two points on a circle
A diameter is a chord passing through the centre.
The word diameter is also used for the length of the diameter.
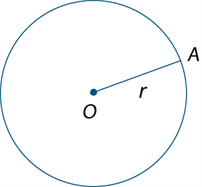
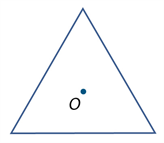
- Circle
The circle with centre O and radius r is the set of all points in the plane whose distance from O is r.
The line segment OA (interval OA) is also called a radius of the circle.
Putting the point of a pair of compasses at the centre and opening the arms to the radius can draw a circle.
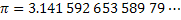
Pi is the name of the Greek letter
that is used to denote the ratio of the circumference of any circle to its diameter. The number
is irrational, but
is a rational approximation accurate to 2 decimal places. The decimal expansion of
There is a very long history of attempts to estimate
The decimal expansion of
places.
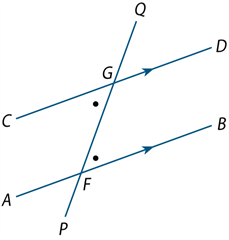
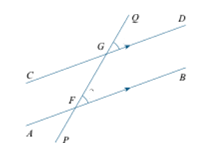
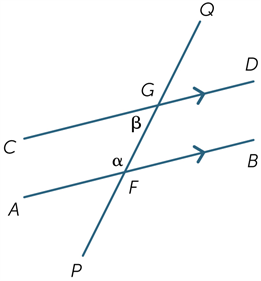
- Cointerior angles
In each diagram the two marked angles are called co-interior angles and lie on the same side of the transversal.
If the lines AB and CD are parallel then a + b = 180o
Cointerior angles formed by parallel lines are supplementary.
Conversely, if a pair of cointerior angles is supplementary then the lines are parallel.
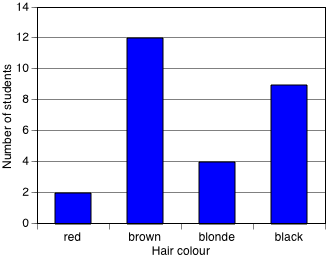
- Column graph
A column graph is a graph used in statistics for organising and displaying categorical data.
To construct a column graph, equal width rectangular bars are constructed for each category with height equal to the observed frequency of the category as shown in the example below which displays the hair colours of 27 students.
Column graphs are frequently called bar graphs or bar charts. In a bar graph or chart, the bars can be either vertical or horizontal.
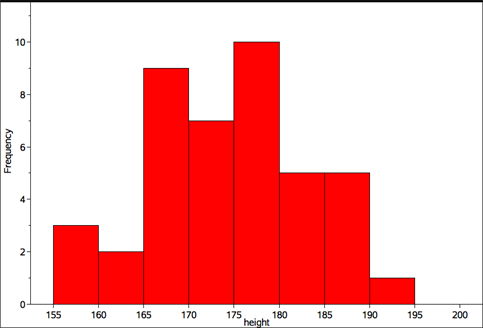
A histogram is a statistical graph for displaying the frequency distribution of continuous data.
A histogram is a graphical representation of the information contained in a frequency table. In a histogram, class frequencies are represented by the areas of rectangles centred on each class interval. The class frequency is proportional to the rectangle’s height when the class intervals are all of equal width.
The histogram below displays the frequency distribution of the heights (in cm) of a sample of 42 people with class intervals of width 5 cm.
- Common factor
A common factor (or common divisor) of a set of numbers or algebraic expression is a factor of each element of that set.
For example,
is a common factor of
and
is a common factor of
and
- Commutative
A method of combining two numbers or algebraic expressions is commutative if the result of the combination does not depend on the order in which the objects are given.
For example, addition of numbers is commutative, and the corresponding commutative law is:
for all numbers
Multiplication is also commutative:
for all numbers
but subtraction and division are not, because, for example,
and
- Complementary events
Events A and B are complementary events, if A and B are mutually exclusive and Pr(A) + Pr(B) = 1.
- Composite number
A natural number that has a factor other than 1 and itself is a composite number.
- Compound interest
The interest earned by investing a sum of money (the principal) is compound interest if each successive interest payment is added to the principal for the purpose of calculating the next interest payment.
For example, if the principal
earns compound interest at the rate of
per period, then after
periods the principal plus interest is
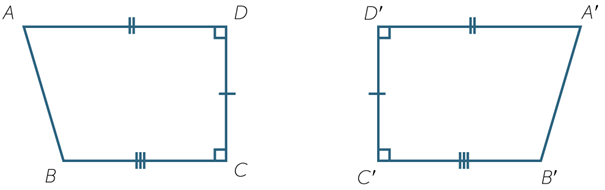
- Congruence
Two plane figures are called congruent if one can be moved by a sequence of translations, rotations and reflections so that it fits exactly on top of the other figure.
Two figures are congruent when we can match every part of one figure with the corresponding part of the other figure. For example, the two figures below are congruent.
Matching intervals have the same length, and matching angles have the same size.
- Congruent triangles
The four standard congruence tests for triangles.
Two triangles are congruent if:
SSS: the three sides of one triangle are respectively equal to the three sides of the other triangle, or
SAS: two sides and the included angle of one triangle are respectively equal to two sides and the included angle of the other triangle, or
AAS: two angles and one side of one triangle are respectively equal to two angles and the matching side of the other triangle, or
RHS: the hypotenuse and one side of one right‐angled triangle are respectively equal to the hypotenuse and one side of the other right‐angled triangle.
- Continuous variable
A continuous variable is a numerical variable that can take any value that lies within an interval. In practice, the values taken are subject to the accuracy of the measurement instrument used to obtain these values.
Examples include height, reaction time to a stimulus and systolic blood pressure.
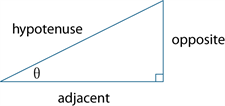
- Cosine
In any right-angled triangle,
cos θ =
where 0o < θ < 90o
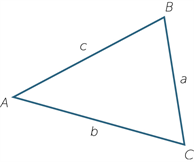
In any triangle ABC,
c2 = a2 + b2 − 2ab cos C
- Counting number
The counting numbers are the non-negative integers, that is, one of the numbers
Sometimes it is taken to mean only a positive integer.
A natural number is a positive integer or counting number. The natural numbers are
The set of natural numbers is usually denoted by
- Counting on
Counting a collection, or reciting a sequence of number words, from a point beyond the beginning of the sequence.
For example, when a child has counted to established that there are 6 objects in a collection and is then asked “How Many?” after several more are added might count on from 6 saying “7, 8, 9, ...” to reach the total. This is considered a more sophisticated strategy than counting the whole collection from 1.
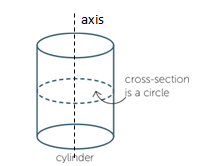
- Cylinder
A cylinder is a solid that has parallel circular discs of equal radius at the ends. Each cross-section parallel to the ends is a circle with the same radius, and the centres of these circular cross-sections lie on a straight line, called the axis of the cylinder.
- Data
Data is a general term for a set of observations and measurements collected during any type of systematic investigation.
Primary data is data collected by the user. Secondary data is data collected by others. Sources of secondary data include, web-based data sets, the media, books, scientific papers, etc.
Univariate data is data relating to a single variable, for example, hair colour or the number of errors in a test.
- Data display
A data display is a visual format for organising and summarising data.
Examples include, box plots, column graphs, frequency tables and stem plots.
- Decimal
A decimal is a numeral in the decimal number system.
For example, the decimal expansion of
is
. The integer part is
and the fractional part is
A decimal is terminating if the fractional part has only finitely many decimal digits. It is non-terminating if it has infinitely digits.
For example,
, where the pattern 16 repeats indefinitely, is non-terminating.
Non-terminating decimals may be recurring, that is, contain a pattern of digits that repeats indefinitely after a certain number of places.
For example,
where the number of 0’s between the 1’s increases indefinitely, is not recurring.
It is common practice to indicate the repeating part of a recurring decimal by using dots or lines as superscripts.
For example,
or
The decimal number system is the base 10, place-value system most commonly used for representing real numbers. In this system positive numbers are expressed as sequences of Arabic numerals 0 to 9, in which each successive digit to the left or right of the decimal point indicates a multiple of successive powers (respectively positive or negative) of 10.
For example, the number represented by the decimal
is the sum
- Denominator
In the fraction
,
is the denominator. It is the number of equal parts into which the whole is divided in order to obtain fractional parts. For example, if a line segment is divided into
equal parts, each of those parts is one fifth of the whole and corresponds to the unit fraction
- Dependent variable
Two events are independent if knowing the outcome of one event tells us nothing about the outcome of the other event.
- Difference
A difference is the result of subtraction one number or algebraic quantity from another.
- Distributive
Multiplication of numbers is distributive over addition because the product of one number with the sum of two others equals the sum of the products of the first number with each of the others. This means that we can multiply two numbers by expressing one (or both) as a sum and then multiplying each part of the sum by the other number (or each part of its sum.)
For example,
This distributive law is expressed algebraically as follows:
- Divisible
In general, a number or algebraic expression
is divisible by another
if there exists a number or algebraic expression
of a specified type for which
A natural number
is divisible by a natural number
For example,
is divisible by 4 because
- Dot plot
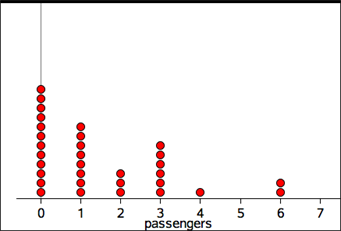
A dot plot is a graph used in statistics for organising and displaying numerical data.
Using a number line, a dot plot displays a dot for each observation. Where there is more that one observation, or observations are close in value, the dots are stacked vertically. If there are a large number of observations, dots can represent more than one observation. Dot plots are ideally suited for organising and displaying discrete numerical data.
The dot plot below displays the number of passengers observed in 32 cars stopped at a traffic light.
Dot plots can also be used to display categorical data, with the numbers on the number line replaced by category labels.
- Element
An element of a set is a member of that set. For example, the elements of the set
are the numbers
We write
to indicate that
- Enlargement (Dilation)
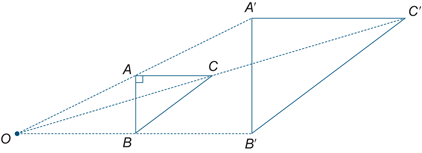
An enlargement is a scaled up (or down) version of a figure in which the transformed figure is in proportion to the original figure. The relative positions of points are unchanged and the two figures are similar.
In the diagram below triangle A′B′C′ is the image of triangle ABC under the enlargement with enlargement factor 2 and centre of enlargement O.
- Equally Likely outcomes
Equally likely outcomes occur with the same probability.
For example, in tossing a fair coin, the outcome ‘head’ and the outcome ‘tail’ are equally likely.
In this situation, Pr(head) = Pr(tail) = 0.5
- Equation
An equation is a statement that asserts that two numbers or algebraic expressions are equal in value. An equation must include an equal sign. For example,
An identity is an equation involving algebraic expressions that is true for all values of the variables involved.
For example
An identity is an equation that is true for all values of the variables involved.
Example:
An inequality is a statement that one number or algebraic expression is less than (or greater than) another. There are four types of inequalities:
- The relation
is less than
-
,
-
, and
-
.
- The relation
- Equivalent fractions
Two fractions
are equivalent if they are equal, that is,
Equivalent fractions are alternative ways of writing the same fraction.
For example,
- Estimate
In statistical terms, an estimate is information about a population extrapolated from a sample of the population.
For example, the mean number of decayed teeth in a randomly selected group of eight-year old children is an estimate of the mean number of decayed teeth in eight-year old children in Australia.
- Even number
A whole number is even if it is divisible by 2. The even whole numbers are
- Event
An event is a subset of the sample space for a random experiment.
For example, the set of outcomes from tossing two coins is { HH,HT,TH,TT }, where H represents a ‘head’ and T a ‘tail’.
For example, if A is the event ‘at least one head is obtained’, then A = { HT,TH, HH }.
Two events A and B are mutually exclusive if one is incompatible with the other; that is, if they cannot be simultaneous outcomes in the same chance experiment.
For example, when a fair coin is tossed twice, the events ‘HH’ and ‘TT’ cannot occur at the same time and are, therefore, mutually exclusive.
In a Venn diagram, as shown below, mutually exclusive events do not overlap.
- Expression
Two or more numbers or variables connected by operations. For example, 17 – 9, 8 x (2 + 3), 2a + 3b are all expressions. Expressions do not include an equal sign.
- Factor
In general, a number or algebraic expression
A natural number
For example,
is a factor of 12 because
A polynomial
is divisible by a polynomial
if there is a polynomial
for which
For example,
is a factor
because
.
A prime factor of a natural number
For example, the prime factors of
are
- Factor and remainder theorem
According to the factor theorem, if
is a polynomial and
for some number
then
This follows easily from the remainder theorem, because for
the remainder is
So if
the remainder is 0 and
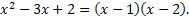
The factor theorem can be used to obtain factors of a polynomial.
For example, if
, then it is easy to check that
So by the factor theorem
is a factor of
According to the remainder theorem, if a polynomial
is divided by
where
, for some polynomial
- Factorise
To factorise a number or algebraic expression is to express it as a product.
For example,
is factorised when expressed as a product:
, and
is factorised when written as a product:
- Fraction
The fraction
(written alternatively as
), where
is a positive integer, was historically obtained by dividing a unit length into
For example,
refers to 3 of 5 equal parts of the whole, taken together.
In the fraction
It is a proper fraction if
and an improper fraction otherwise.
- Frequencies
Frequency, or observed frequency, is the number of times that a particular value occurs in a data set.
For grouped data, it is the number of observations that lie in that group or class interval.
An expected frequency is the number of times that a particular event is expected to occur when a chance experiment is repeated a number of times. For example, If the experiment is repeated n times, and on each of those times the probability that the event occurs is p, then the expected frequency of the event is np.
For example, suppose that a fair coin is tossed 5 times and the number of heads showing recorded. Then the expected frequency of ‘heads’ is 5/2.
This example shows that the expected frequency is not necessarily an observed frequency, which in this case is one of the numbers 0,1,2,3,4 or 5.
A frequency table lists the frequency (number of occurrences) of observations in different ranges, called class intervals.
The frequency distribution of the heights (in cm) of a sample of 42 people is displayed in the frequency table below
Height (cm)
Class interval Frequency 155-<160 3 160-<165 2 165-<170 9 170-<175 7 175-<180 10 180-<185 5 185-<190 5 185-<190 5 A frequency distribution is the division of a set of observations into a number of classes, together with a listing of the number of observations (the frequency) in that class.
Frequency distributions can be displayed in tabular or graphical form.
Frequency, or observed frequency, is the number of times that a particular value occurs in a data set.
For grouped data, it is the number of observations that lie in that group or class interval.
Relative frequency is given by the ratio
, where f is the frequency of occurrence of a particular data value or group of data values in a data set and n is the number of data values in the data set.
- Frequency table
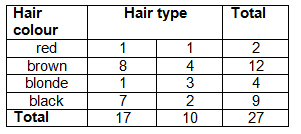
A two-way frequency table is commonly used to for displaying the two-way frequency distribution that arises when a group of individuals or things are categorised according to two criteria.
For example, the two-way table below displays the two-way frequency distribution that arises when 27 children are categorised according to hair type (straight or curly) and hair colour (red, brown, blonde, black).
The information in a two-way frequency table can also be displayed graphically using a side-by-side column graph.
- Function
A function
assigns to each element of one set
precisely one element of a second set
.
The functions most commonly encountered in elementary mathematics are real functions of real variables. For such functions, the domain and codomain are sets of real numbers.
Functions are usually defined by a formula for
in terms of
For example, the formula
defines the ‘squaring function’ that maps each real number
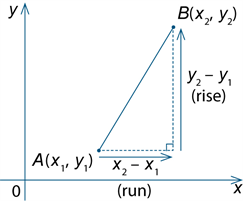
- Gradient
If A(x1,y1) and points B(x2, y2) are points in the plane, x2 – x1 ≠ 0, the gradient of the line segment (interval) AB =
=
.
The gradient of a line is the gradient of any line segment (interval) within the line.
- Greatest common divisor
The greatest common divisor (gcd), greatest common factor (gcf) or highest common factor (hcf), of a given set of natural numbers is the common divisor of the set that is greater than each of the other common divisors.
For example,
are the common factors of 24,54 and 66 and 6 is the greatest common divisor.
- Histogram
A histogram is a statistical graph for displaying the frequency distribution of continuous data.
A histogram is a graphical representation of the information contained in a frequency table. In a histogram, class frequencies are represented by the areas of rectangles centred on each class interval. The class frequency is proportional to the rectangle’s height when the class intervals are all of equal width.
The histogram below displays the frequency distribution of the heights (in cm) of a sample of 42 people with class intervals of width 5 cm.
- Independent event
Two events are independent if knowing the outcome of one event tells us nothing about the outcome of the other event.
- Independent variable
When investigating relationships in bivariate data, the explanatory variable is the variable that may explain or cause a difference in the response variable.
For example, when investigating the relationship between the temperature of a loaf of bread and the time it has spent in a hot oven, temperature is the response variable and time is the explanatory variable.
With numerical bivariate data it is common to attempt to model such relationships with a mathematic equation and to call the response variable the dependent variable and the explanatory variable the independent variable.
When graphing numerical data, the convention is to display the response (dependent) variable on the vertical axis and the explanatory (independent) variable on the horizontal axis.
When there is no clear causal link between the events, the classification of the variables as either the dependent or independent variable is quite arbitrary.
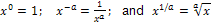
- Index
Index is synonymous with exponent.
The exponent or index of a number or algebraic expression is the power to which the latter is be raised. The exponent is written as a superscript. Positive integral exponents indicate the number of times a term is to be multiplied by itself. For example,
- Index law
Index laws are rules for manipulating indices (exponents). They include
and
- Informal unit
Informal units are not part of a standardised system of units for measurement. For example, an informal unit for length could paperclips of uniform length. An informal unit for area could be uniform paper squares of any size. Informal units are sometimes referred to as non-standard units.
- Integer
The integers are the ‘whole numbers’
. The set of integers is usually denoted by
Integers are basic building blocks in mathematics.
- Interquartile range
The interquartile range (IQR) is a measure of the spread within a numerical data set. It is equal to the upper quartile (Q3) minus the lower quartiles (Q1); that is, IQR = Q3 – Q1
The IQR is the width of an interval that contains the middle 50% (approximately) of the data values. To be exactly 50%, the sample size must be a multiple of four.
- Interval
An interval is a certain type of subset of the number line.
A finite interval is the set of all real numbers between two given real numbers called the end points of the interval. The end points may or may not be included in the interval.
- Irrational number
An irrational number is a real number that is not rational. Some commonly used irrational numbers are π, e and
.
The Euler number is an irrational real number whose decimal expansion begins
- Irregular shape
An irregular shape can be a polygon. A polygon that is not regular is irregular.
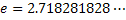
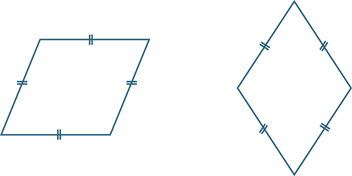
- Kite
A kite is a quadrilateral with two pairs of adjacent sides equal.
A kite may be convex as shown in the diagram above to the left or non-convex as shown above to the right. The axis of the kite is shown.
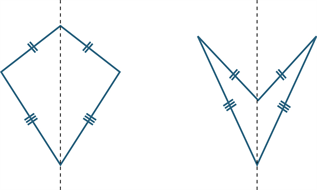
- Line segment (Interval)
If A and B are two points on a line, the part of the line between and including A and B is called a line segment or interval.
The distance AB is a measure of the size or length of AB.
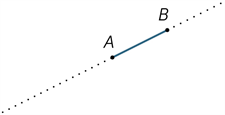
Any point A on a line divides the line into two pieces called rays. The ray AP is that ray which contains the point P (and the point A). The point A is called the vertex of the ray and it lies on the ray.
- Linear equation
A linear equation is an equation involving just linear terms, that is, polynomials of degree 1. The general form of a linear equation in one variable is
- Location (statistics)
A measure of location is a single number that can be used to indicate a central or ‘typical value’ within a set of data.
The most commonly used measures of location are the mean and the median although the mode is also sometimes used for this purpose.
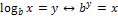
- Logarithm
The logarithm of a positive number
is the power to which a given number
. Algebraically:
For example,
because
and
because
- Many-to-one correspondence
A many-to-one correspondence is a function or mapping that takes the same value for at least two different elements of its domain. For example, the squaring function
is many-to-one because
for all real numbers.
- Mean
The arithmetic mean of a list of numbers is the sum of the data values divided by the number of numbers in the list.
In everyday language, the arithmetic mean is commonly called the average.
For example, for the following list of five numbers { 2, 3, 3, 6, 8 } the mean equals
- Median
The median is the value in a set of ordered data that divides the data into two parts. It is frequently called the ‘middle value’.
Where the number of observations is odd, the median is the middle value.
For example, for the following ordered data set with an odd number of observations, the median value is five.
1 3 3 4 5 6 8 9 9
Where the number of observations is even, the median is calculated as the mean of the two central values.
For example, in the following ordered data set, the two central values are 5 and 6, and median value is the mean of these two values, 5.5
1 3 3 4 5 6 8 9 9 10
The median provides a measure of location of a data set that is suitable for both symmetric and skewed distributions and is also relatively insensitive to outliers.
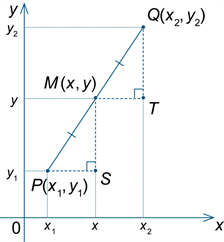
- Midpoint
The midpoint M of a line segment (interval) AB is the point that divides the segment into two equal parts.
Let A(x1, y1) be points in the Cartesian plane. Then the midpoint M of line segment AB has coordinates (
,
).
This can be seen from the congruent triangles below.
- Mode
The mode is the most frequently occurring value in a set of data. There can be more than one mode. When there are two modes, the data set is said to be bimodal.
The mode is sometimes used as a measure of location.
- Monic
A monic polynomial is one in which the coefficient of the leading term is 1. For example,
is monic, but
is not.
- Multiple
A multiple of a number is the product of that number and an integer.
A multiple of a real number
and -13.5 are multiples of
because
and
.
- Multiplication
Multiplicative situations are problems or contexts that involve multiplication (or division). Calculating the number of seats in a theatre that has 30 rows of 24 seats, finding equivalent fractions, and working with ratios and percentages are all multiplicative situations.
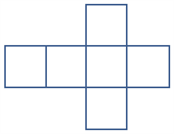
- Net
A net is a plane figure that can be folded to form a polyhedron.
One possible net for a cube is shown below.
- Number
A real number is rational if it can be expressed as a quotient of integers. It is irrational otherwise.
- Number line
A number line gives a pictorial representation of real numbers.
- Numeral
A figure or symbol used to represent a number. For example, -3, 0, 45, IX
- Numerator
In the fraction
,
- Numerical data
Numerical data is data associated with a numerical variable.
Numerical variables are variables whose values are numbers, and for which arithmetic processes such as adding and subtracting, or calculating an average, make sense.
- Odd and even number
A whole number is even if it is divisible by 2. The even whole numbers are
An odd number is an integer that is not divisible by 2. The odd numbers are
- One-to-one correspondence
In early counting development one-to-one correspondence refers to the matching of one and only one number word to each element of a collection.
More generally it refers to a relationship between two sets such that every element of the first set corresponds to one and only one element of the second set.
- Operation
The process of combining numbers or expressions. In the primary years operations include addition, subtraction, multiplication and division. In later years operations include substitution and differentiation.
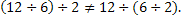
- Order of operations
A convention for simplifying expressions that stipulates that multiplication and division are performed before addition and subtraction and in order from left to right. For example, in 5 – 6 ÷ 2 +7, the division is performed first and the expression becomes 5 – 3 + 7 = 9. If the convention is ignored and the operations are performed in order, the incorrect result, 6.5 is obtained.
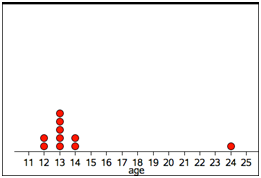
- Outlier
An outlier is a data value that appears to stand out from the other members of the data set by being unusually high or low. The most effective way of identifying outliers in a data set is to graph the data.
For example, in following list of ages of a group of 10 people, { 12, 12, 13, 13, 13, 13, 13, 14, 14, 14, 24 }, the 24 would be considered to be a possible outlier.
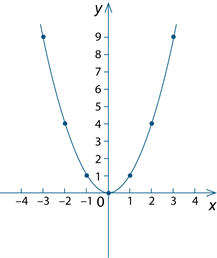
- Parabola
Definition 1
The graph of y = x2 is called a parabola. The point (0, 0) is called the vertex of the parabola and the y axis is the axis of symmetry of the parabola called simply the axis.
Some other parabolas are the graphs of y = ax2 + bx + c where a ≠ 0.
More generally, every parabola is similar to the graph of y = x2.
Definition 2
A parabola is the locus of all points P such that the distance from P to a fixed point F is equal to the distance from P to a fixed line l.
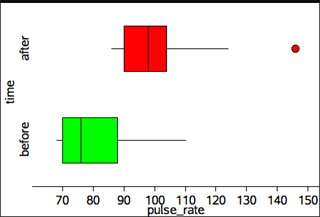
- Parallel box plots
Parallel box-and-whisker-plots are used to visually compare the five-number summaries of two or more data sets.
For example, box-and-whisker-plots below can be used to compare the five-number summaries for the pulse rates of 19 students before and after gentle exercise.
Note that the box plot for pulse rates after exercise shows the pulse rate of 146 as a possible outlier (.). This is because the distance of this data point above the upper quartile 42 (146-104) is more than 21 (1.5 ´ IQRs = 1.5 ´ (104 – 90) = 1.5 ´ 14 = 21).
The term ‘parallel box-and-whisker plots’ is commonly abbreviated to ‘parallel boxplots’.
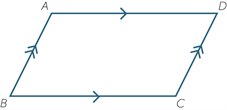
- Parallelogram
A parallelogram is a quadrilateral whose opposite sides are parallel.
Thus the quadrilateral ABCD shown below is a parallelogram because AB || DC and DA || CB.
Properties of a parallelogram
- The opposite angles of a parallelogram are equal.
- The opposite sides of a parallelogram are equal.
- The diagonals of a parallelogram bisect each other.
- Partitioning
Dividing a quantity into parts. In the early years it commonly refers to the ability to think about numbers as made up of two parts, for example, 10 is 8 and 2. In later years it refers to dividing both continuous and discrete quantities into equal parts.
- Percentage
A percentage is a fraction whose denominator is 100.
For example,
percent (written as
) is the percentage whose value is
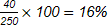
Similarly, 40 as a percentage of 250 is
- Perimeter
The perimeter of a plane figure is the length of its boundary.
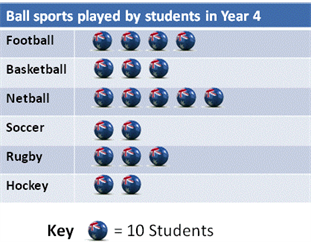
- Picture graphs
A picture graph is a statistical graph for organising and displaying categorical data.
- Place value
The value of digit as determined by its position in a number relative to the ones (or units) place. For integers the ones place is occupied by the rightmost digit in the number.
For example in the number 2 594.6 the 4 denotes 4 ones, the 9 denotes 90 ones or 9 tens, the 5 denotes 500 ones or 5 hundreds, the 2 denotes 2000 ones or 2 thousands, and the 6 denotes
of a one or 6 tenths.
- Point
A point marks a position, but has no size.
- Polynomial
A polynomial in one variable
where
is a non-negative integer.
A non-zero polynomial can be written in the form
where
- Population
A population is the complete set of individuals, objects, places, etc, that we want information about.
A census is an attempt to collect information about the whole population.
- Prime number
A prime number is a natural number greater than 1 that has no factor other 1 and itself.
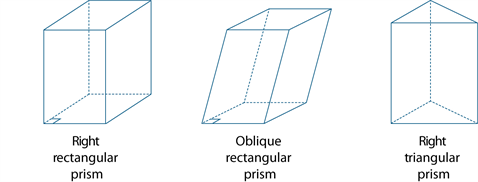
- Prism
A prism is a convex polyhedron that has two congruent and parallel faces and all its remaining faces are parallelograms.
A right prism is a convex polyhedron that has two congruent and parallel faces and all its remaining faces are rectangles. A prism that is not a right prism is often called an oblique prism.
Some examples of prisms are shown below.
- Probability
The probability of an event is a number between 0 and 1 that indicates the chance of something happening.
For example the probability that the sun will come up tomorrow is 1, the probability that a fair coin will come up ‘heads’ when tossed is 0.5, while the probability of someone being physically present in Adelaide and Brisbane at exactly the same time is zero.
- Product
A product is the result of multiplying together two or more numbers or algebraic expressions.
For example,
is the product of
and
and
is product of
and
- Proportion
Corresponding elements of two sets are in proportion if there is a constant ratio. For example, the circumference and diameter of a circle are in proportion because for any circle the ratio of their lengths is the constant
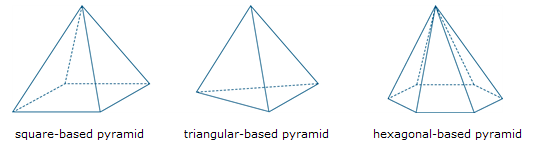
- Pyramid
A pyramid is a convex polyhedron with a polygonal base and triangular sides that meet at a point called the vertex. The pyramid is named according to the shape of its base.
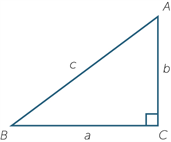
- Pythagoras’ theorem
Pythagoras’ theorem
For a right-angled triangle
- The square of the hypotenuse of a right-angled triangle equals the sum of the squares of the lengths of the other two sides.
- In symbols, c2 = a2 + b2.
The converse
If c2 = a2 + b2 in a triangle ABC, then ∠C is a right angle.
- Quadratic equation
The general quadratic equation in one variable is
where
The roots are given by the quadratic formula
- Quadratic expression
A quadratic expression or function contains one or more of the terms in which the variable is raised to the second power, but no variable is raised to a higher power. Examples of quadratic expressions include
and
- Quartile
Quartiles are the values that divide an ordered data set into four (approximately) equal parts. It is only possible to divide a data set into exactly four equal parts when the number of data of values is a multiple of four.
There are three quartiles. The first, the lower quartile (Q1) divides off (approximately) the lower 25% of data values. The second quartile (Q2) is the median. The third quartile, the upper quartile (Q3), divides off (approximately) the upper 25% of data values.
Percentiles are the values that divide an ordered data set into 100 (approximately) equal parts. It is only possible to divide a data set into exactly 100 equal parts when the number of data values is a multiple of one hundred.
There are 99 percentiles. Within the above limitations, the first percentile divides off the lower 1% of data values. The second, the lower 2% and so on. In particular, the lower quartile (Q1) is the 25th percentile, the median is the 50th percentile and the upper quartile is the 75th percentile.
- Quotient
A quotient is the result of dividing one number or algebraic expression by another. See also remainder.
- Random number
A random number is one whose value is governed by chance; for example, the number of dots showing when a fair die is tossed. The value of a random number cannot be predicted in advance.
- Range (statistics)
The range is the difference between the largest and smallest observations in a data set.
The range can be used as a measure of spread in a data set, but it is extremely sensitive to the presence of outliers and should only be used with care.
- Rate
A rate is particular kind of ratio in which the two quantities are measured in different units. For example, the ratio of distance to time, known as speed is a rate because distance and time are measured in different units (such as kilometres and hours). The value of the rate depends on the units in which of the quantities are expressed.
- Ratio
A ratio is a quotient or proportion of two numbers, magnitudes or algebraic expressions. It is often used as a measure of the relative size of two objects. For example the ratio of the length of a side of a square to the length of a diagonal is
that is,
- Real numbers
The numbers generally used in mathematics, in scientific work and in everyday life are the real numbers. They can be pictured as points on a number line, with the integers evenly spaced along the line, and a real number
A real number is either rational or irrational.
Every real number has a decimal expansion. Rational numbers are the ones whose decimal expansions are either terminating or recurring.
- Rectangle
A rectangle is a quadrilateral in which all angles are right angles
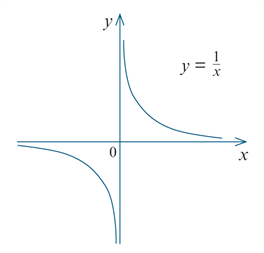
- Rectangular Hyperbola
The graph of y = 1/x is called a rectangular hyperbola. The x and y axes are asymptotes as the curve gets as close as we like to them.
- Recurring decimal
A recurring decimal is a decimal that contains a pattern of digits that repeats indefinitely after a certain number of places.
For example,
and this is the decimal expansion of the rational number
Every recurring decimal is the decimal expansion of a rational number
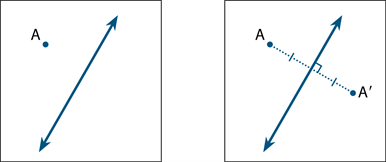
- Reflection
To reflect the point A in an axis of reflection, a line has been drawn at right angles to the axis of reflection and the point A′ is marked at the same distance from the axis of reflection as A, but on the other side.
The point A′ is called the reflection image of A.
A reflection is a transformation that moves each point to its reflection image.
- Related denominators
Denominators are related when one is a multiple of the other. For example, the fractions
and
have related denominators because 9 is a multiple of 3.
Fractions with related denominators are more easily added and subtracted than fractions with unrelated denominators because only one needs to be renamed. For example to add
and then compute
=
.
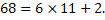
- Remainder
A remainder is the amount left over when one number or algebraic quantity
For example, when 68 is divided by 11, the remainder is 2, because 68 can be expressed as
- Rhombus
A rhombus is a quadrilateral with all sides equal.
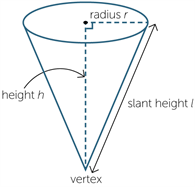
- Right Cone
A cone is a solid that is formed by taking a circle called the base and a point not in the plane of the circle, called the vertex, which lies above or below the circle and joining the vertex to each point on the circle.
If the vertex is directly above or below the centre of the circular base, we call the cone a right cone.
The height of the cone is the distance from the vertex to the centre of the circular base.
The slant height of a cone is the distance from any point on the circle to the vertex to the circle.
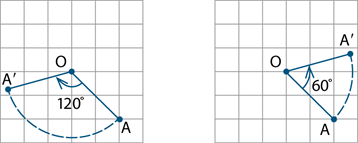
- Rotation
A rotation turns a figure about a fixed point, called the centre of rotation.
A rotation is specified by:
- the centre of rotation O
- the angle of rotation
- the direction of rotation (clockwise or anticlockwise).
In the first diagram below, the point A is rotated through 120o clockwise about O. In the second diagram, it is rotated through 60o anticlockwise about O.
A rotation is a transformation that moves each point to its rotation image.
- Rounding
The decimal expansion of a real number is rounded when it is approximated by a terminating decimal that has a given number of decimal digits to the right of the decimal point.
Rounding to
digit to the right of the decimal place, and adjusting the remaining digits where necessary.
If the first digit removed (the
digit) is less than 5 the preceding digit is not changed.
For example,
becomes
when rounded to 3 decimal places.
If the first digit removed is greater than 5, or 5 and some succeeding digit is non-zero, the preceding digit is increased by 1. For example,
becomes
when rounded to 5 decimal places.
- Sample
A sample is part of a population. It is a subset of the population, often randomly selected for the purpose of estimating the value of a characteristic of the population as a whole.
For instance, a randomly selected group of eight-year old children (the sample) might be selected to estimate the incidence of tooth decay in eight-year old children in Australia (the population).
- Sample space
A sample space is the set of all possible outcomes of a chance experiment. For example, the set of outcomes (also called sample points) from tossing two heads is { HH, HT, TH, TT }, where H represents a ‘head’ and T a ‘tail’.
- Scientific notation
A positive real number is expressed in scientific notation when it is written as the product of a power of
and a decimal that has just one digit to the left of the decimal point.
For example, the scientific notation for
is
and the scientific notation for
is
Many electronic calculators will show these as
and
- Secondary data set
Primary data is data collected by the user. Secondary data is data collected by others. Sources of secondary data include, web-based data sets, the media, books, scientific papers, etc.
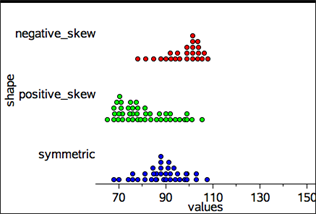
- Shape (statistics)
The shape of a numerical data distribution is mostly simply described as symmetric if it is roughly evenly spread around some central point or skewed, if it is not. If a distribution is skewed, it can be further described as positively skewed (‘tailing-off’ to the upper end of the distribution) or negatively skewed (‘tailing-off’ to the lower end of the distribution).
These three distribution shapes are illustrated in the parallel dot plot display below.
Dot plots, histograms and stem plots can all be used to investigate the shape of a data distribution.
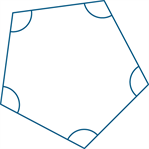
- Shapes (geometry)
A polygon is plane figure bounded by line segments.
The figure shown above is a regular pentagon. It is a convex five-sided polygon. It is called a pentagon because it has five sides. It is called regular because all sides have equal length and all interior angles are equal.
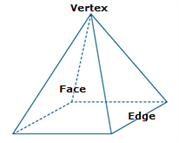
A polyhedron is a solid figure bounded by plane polygonal faces. Two adjacent faces intersect at an edge and each edge joins two vertices.
The polyhedron shown above is a pyramid with a square base. It has 5 vertices, 8 edges and 5 faces. It is a convex polyhedron.
The figure above is a non-convex polyhedron.
A convex polyhedron is a finite region bounded by planes, in the sense that the region lies entirely on one side of the plane.
A regular shape can be a polygon. A polygon is regular if all of its sides are the same length and all of its angles have the same measure.
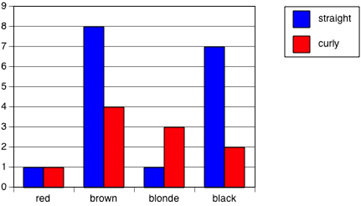
- Side-by-side column graph
A side-by-side column graph can be used to organise and display the data that arises when a group of individuals or things are categorised according to two or more criteria.
For example, the side-by-side column graph below displays the data obtained when 27 children are categorised according to hair type (straight or curly) and hair colour (red, brown, blonde, black). The legend indicates that blue columns represent children with straight hair and red columns children with curly hair.
Side-by-side column graphs are frequently called side-by-side bar graphs or bar charts. In a bar graph or chart, the bars can be either vertical or horizontal.
- Similar
The four standard tests for two triangles to be similar.
AAA: If two angles of one triangle are respectively equal to two angles of another triangle, then the two triangles are similar.
SAS: If the ratio of the lengths of two sides of one triangle is equal to the ratio of the lengths of two sides of another triangle, and the included angles are equal, then the two triangles are similar.
SSS: If we can match up the sides of one triangle with the sides of another so that the ratios of matching sides are equal, then the two triangles are similar.
RHS: If the ratio of the hypotenuse and one side of a right-angled triangle is equal to the ratio of the hypotenuse and one side of another right-angled triangle, then the two triangles are similar.
- Similarity
Two plane figures are called similar if an enlargement of one figure is congruent to the other.
That is, if one can be mapped to the other by a sequence of translations, rotations, reflections and enlargements.
Similar figures thus have the same shape, but not necessarily the same size.
- Simple interest
Simple interest is the interest accumulated when the interest payment in each period is a fixed fraction of the principal. For example, if the principle
per period, then after
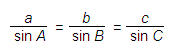
- Sine
In any right-angled triangle,
sin θ =
, where 0o < θ < 90o
In any triangle ABC,
In words it says:
Any side of a triangle over the sine of the opposite angle equals any other side of the triangle over the sine of its opposite angle.
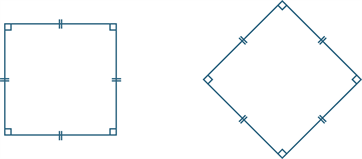
- Square
A square is a quadrilateral that is both a rectangle and a rhombus.
A square thus has all the properties of a rectangle, and all the properties of a rhombus.
- Standard deviation
Standard deviation is a measure of the variablity or spread of a data set. It gives an indication of the degree to which the individual data values are spread around their mean.
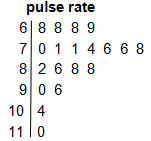
- Stem and leaf plot
A stem-and-leaf plot is a method of organising and displaying numerical data in which each data value is split in to two parts, a ‘stem’ and a ‘leaf’.
For example, the stem-and-leaf plot below displays the resting pulse rates of 19 students.
In this plot, the stem unit is ‘10’ and the leaf unit is ‘1’. Thus the top row in the plot 6 | 8 8 8 9 displays pulse rates of 68, 68, 68 and 69.
Stemplot is a synonym for stem-and-leaf plot.
- Subitising
Recognising the number of objects in a collection without consciously counting
- Sum
A sum is the result of adding together two of more numbers or algebraic expressions.
- Surd
A surd is a numerical expression involving one or more irrational roots of numbers. Examples of surds include
,
and
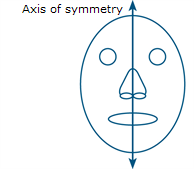
- Symmetrical
Line symmetry
A plane figure F has line symmetry in a line m if the image of F under the reflection in m is F itself. The line m is called the axis of symmetry.
Rotational symmetry
A plane figure F has rotational symmetry about a point O if there is a non-trivial rotation such that the image of F under the rotation is F itself.
A rotation of 120o around O moves the equilateral triangle onto itself.
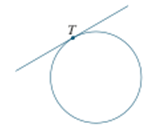
- Tangent
A tangent to a circle is a line that intersects a circle at just one point. It touches the circle at that point of contact, but does not pass inside it.
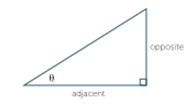
- Tangent
In any right-angled triangle,
tan θ = opposite / adjacent, where 0° < θ < 90°.
- Terminating decimal
A terminating decimal is a decimal that contains only finitely many decimal digits.
Every terminating decimal represents a rational number
where the denominator is a power of For example,
is the decimal expansion of the sum
- Transformation
The transformations included in this glossary are enlargements, reflections, rotations and translations.
- Translation
Shifting a figure in the plane without turning it is called translation. To describe a translation, it is enough to say how far left or right and how far up or down the figure is moved.
A translation is a transformation that moves each point to its translation image.
- Transversal
A transversal is a line that meets two or more other lines in a plane.
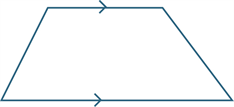
- Trapezium
A trapezium is a quadrilateral with one pair of opposite sides parallel.
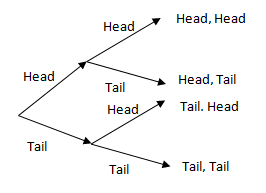
- Tree diagram
A tree diagram is a diagram that can used to enumerate the outcomes of a multi-step random experiment.
The diagram below shows a tree diagram that has been used to enumerate all of the possible outcomes when a coin is tossed twice This is an example of a two-step random experiment.
- Triangular number
A triangular number is the number of dots required to make a triangular array of dots in which the top row consists of just one dot, and each of the other rows contains one more dot than the row above it. So the first triangular number is
, the second is
the third is
and so on.
- Trigonometric ratios
Sine, Cosine, Tangent
- Unit fraction
A unit fraction is a simple fraction whose numerator is 1, that is, a fraction of the form
where
- Variable
Numerical variables are variables whose values are numbers, and for which arithmetic processes such as adding and subtracting, or calculating an average, make sense.
A discrete numerical variable is a numerical variable, each of whose possible values is separated from the next by a definite ‘gap’. The most common numerical variables have the counting numbers 0,1,2,3,… as possible values. Others are prices, measured in dollars and cents.
Examples include the number of children in a family or the number of days in a month.
- Variable (algebra)
A variable is a symbol, such as
used to represent an unspecified member of some set. For example, the variable
- Variable (statistics)
A variable is something measurable or observable that is expected to either change over time or between individual observations.
Examples of variables in statistics include the age of students, their hair colour or a playing field’s length or its shape.
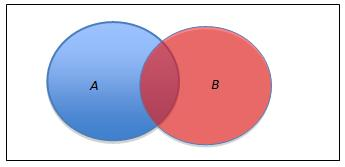
- Venn diagram
A Venn diagram is a graphical representation of the extent to which two or more events, for example A and B, are mutually inclusive (overlap) or mutually exclusive (do not overlap).
- Vertically opposite angle
When two lines intersect, four angles are formed at the point of intersection. In the diagram, the angles marked ∠AOX and ∠BOY are called vertically opposite.
Vertically opposite angles are equal.
- Volume
The volume of a solid region is a measure of the size of a region.
For a rectangular prism, Volume = Length × Width × Height
- Whole number
A whole number is a non–negative integer, that is, one of the numbers
,
Sometimes it is taken to mean only a positive integer, or any integer.